

Maps ignite passion, inspire dreams, and stoke our sense of adventure. Whether you’re getting lost in the details of an ancient map or planning a trip using a modern mapping app, there’s something undeniably appealing about discovering unfamiliar places—and rediscovering familiar ones—using a map as your guide.
It’s impossible to overstate the impact that maps have had on human history, and on the impact they still have on our day-to-day lives, even when we don’t realize it. Maps shape the way we see the world and our place in it. Without the 10 maps listed below, our world would be a very different place indeed.

Ptolemy’s World Map (150 AD)
Known for his contributions to mathematics, astronomy, geography and music theory, it’s safe to say Claudius Ptolemy was a pretty influential guy. Over his lifetime from c. 100 to c. 170 AD, Ptolemy made some of the the Roman Empire’s most notable contributions to civilization. Chief among them is the treatise Geography, published in c. 150 AD.
Contained within that treatise was Ptolemy’s world map, which was one of the most complete attempts ever made at that time to map out the known world (consisting mostly of the Mediterranean region). The map was also notable for being the first to use celestial observations to pinpoint locations on Earth, and the first to use lines of latitude and longitude.

The Tabula Rogeriana (1154)
When King Roger II of Sicily invited Muslim scholar al-Idrisi to his court in the 12th century and asked him to create a book on geography, the result was Tabula Rogeriana (latin for “The Map of Roger,” also known by its full title, The Excursion of One Eager to Penetrate the Horizons. It took al-Idrisi 15 years to complete, and was finally presented in 1154.
The centerpiece of the publication was a large map that included Eurasia and a large section of Africa, and was the most accurate ever created at the time. It remained one of the world’s most popular and influential maps for centuries, although today it may look strange, as it comes from the Islamic tradition of positioning south at the top.

Oldest Known Globe (1492)
Contrary to popular belief, not everybody thought the world was flat prior to Christopher Columbus. Greek astronomers theorized that the world was, in fact, spherical as early as the 3rd century BC, and there’s evidence to suggest that globes were in use as early as the 2nd century BC.
Unfortunately, no globes from that era still exist. The oldest extant globe of the earth was made in 1492 by Martin Behaim, a German cartographer who was under the employ of the king of Portugal at the time. He called it the “Nürnberg Terrestrial Globe,” and it is now more commonly known as the Erdapfel. The globe was hand-drawn, made using layers of linen, wood, parchment and paper.

Waldseemüller Map (1507)
The explorations that expanded human beings’ perception of the world between the late 15th and early 16th century are almost without parallel in history. Suddenly, the world—at least from a European perspective—had vastly grown in size. The Waldseemüller Map, first printed in 1507, really drives that point home.
This map, created by German mapmaker Martin Waldseemüller, is the first to ever use the word “America” to describe the New World. When it was first issued, the map was accompanied by a booklet by Matthias Ringmann, a scholar who was inspired by the explorer Amerigo Vespucci and believed that the Americas were their own continent, not part of Asia, as Columbus thought.

Mercator Projection (1569)
Accurately depicting the spherical earth on a flat surface has presented cartographers with a serious challenge since the earliest days of mapmaking. The Mercator Projection, developed by Flemish geographer and cartographer Gerardus Mercator and first presented in 1569, is one of the most well-known attempts to solve this issue.
The Mercator Projection became the most popular type of map projection by the 1800s, and was a staple of classrooms well into the 20th century. The obvious problem with this map, as critics often point out, is that it exaggerates the size of landmasses at extreme latitudes, such as Greenland and Antarctica. Even so, it can still be found on many contemporary wall maps and publications, though it is often printed alongside other, more modern projections.
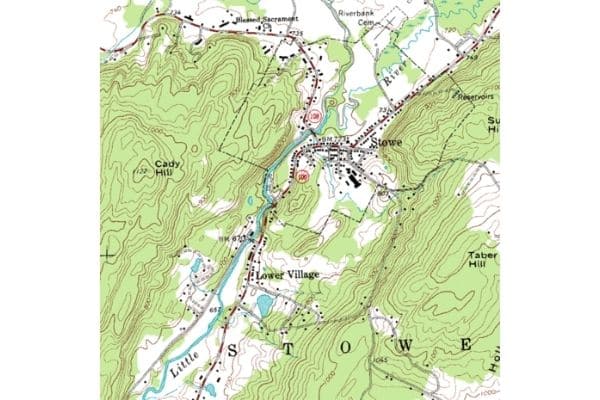
Topographic Mapping (1789)
We’ve all seen topographic maps, which show both natural and manmade features, traditionally using contour lines to delineate changes in elevation. These maps have become so ubiquitous—and so essential for everything from travel and recreation to city planning and military operations—that it’s hard to believe they’ve only been around for a few hundred years.
The first complete, large-scale topographic map of an entire country was the Carte géométrique de la France, which mapped out all of France in 1789. Many more topographic maps would follow, showing large and small areas of the world in increasing detail. The U.S. Geological Survey (USGS) published its first topographic map of the United States in 1879.

Broad Street Cholera Map (1854)
This Victorian-era map, which shows only a small portion of the city of London, has had impacts that go far beyond its relatively modest land area. The map was created during the Cholera outbreak of 1854 by John Snow, an English physician attempting to trace the source of the outbreak.
There was no concept of germs at that time, and Snow was skeptical of the prevailing theory that Cholera was caused by miasma or “bad air.” By mapping out cholera cases on this map, he was able to trace the outbreak to a contaminated water pump. In doing so he saved thousands of lives in the short-term, and permanently shifted mankind’s understanding of how diseases spread.

Rand McNally’s First Road Map (1904)
The invention of the automobile changed the way we travel, changed the significance of roadways, and ultimately changed the way we use maps. In 1904, the automobile was still in its infancy, but newer, more modern roads were already spreading across America. It was at this critical moment that Rand McNally published its very first road map.
This first map showed all the roadways in New York City and its vicinity. By 1907, Rand McNally was printing Photo-Auto Guides, which used a combination of maps and photographs to help guide the growing number of motorists on America’s roads.

Winkel Tripel Projection (1921)
The Winkel Tripel Projection is one of several map projections developed during the 20th century in an attempt to solve the problem created by the Mercator Projection. Namely, how do you put a round earth on a flat paper in a way that is both geographically accurate and also “looks right?”
In essence, the Winkel Tripel Projection does so by aiming for a compromise, using curved longitude lines to minimize distortion in area, direction and distance. Although it was developed by Oswald Winkel in 1921, it wasn’t until 1998 that it was adopted as the standard projection by the National Geographic Society, replacing the more well-known Robinson Projection.

Google Maps (2005)
Although it’s been around for less than 20 years, Google Maps has impacted all of our lives. A study in 2020 showed that over 1 billion people used the app in a single month. When Google Maps was first launched in 2005, it made an accurate satellite-based map of the entire planet available to anyone with an internet connection.
Finally, a map that allows you to plot your commute, see far-off places with the click of a button, and even zoom in on your own house (you know that’s the first thing you did). The core of the original application was designed by Danish brothers Lars and Jens Eilstrup Rasmussen in 2004, who surely could not have predicted how far it would go.